Monitoring Sync Status
The Status page in SyncNow provides comprehensive reports on the progress of synchronization processes and sync logs. It allows users to monitor the detailed execution of each sync run, track the status of entities, and quickly identify any errors that occurred during synchronization.
🖥️ Features of the Status Page
Overview
- Each row in the grid represents a synchronization run for one process.
- Each process defines a set of entities to be synchronized.
- Detailed information is available for each sync run, including:
- Log: Detailed execution log of the synchronization process.
- Status Entities: Information about the source and target entities involved in the sync.
- Status Errors: Information about errors encountered during the sync run.
🖼️ Visual Guide
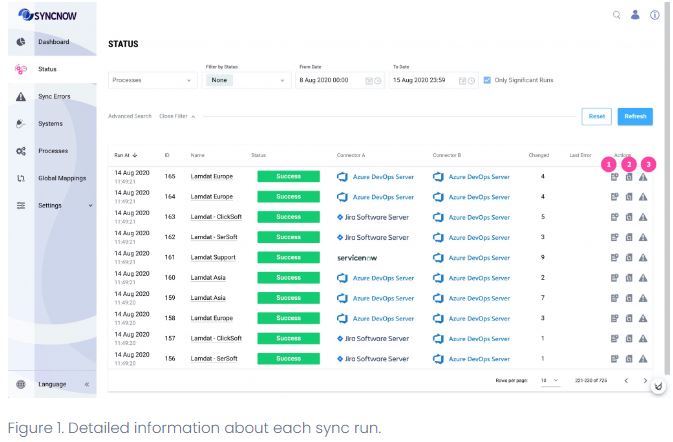 Figure 1: Sync Status Overview
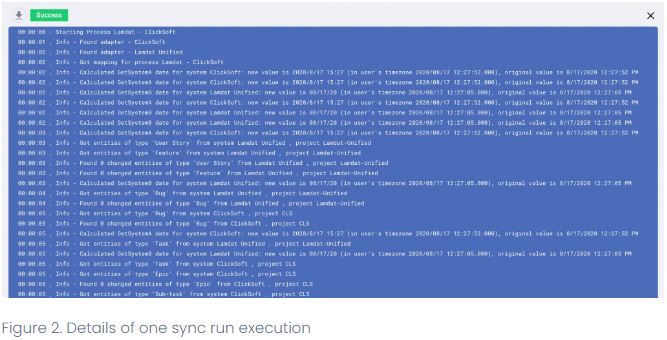 Figure 2: Sync Execution Details
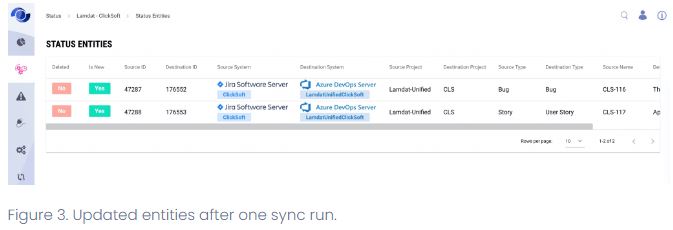 Figure 3: Status of Entities
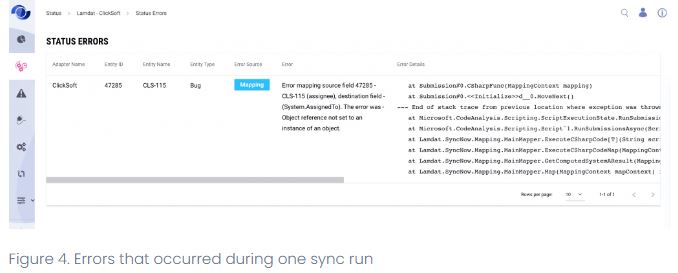 Figure 4: Status of Errors
The frequency of synchronizations is configured on the System Settings page.
📋 How to Read the Status Grid
The Status grid can be filtered to provide insights based on various parameters:
- Processes: Filter by specific synchronization processes.
- Final Status of Synchronization: Filter by Success, Fail, or Partially Success.
- Date-Time Period: Specify the period for which the sync runs are displayed.
- Significant Runs Only: Show only sync runs with one of the following statuses:
- Success with at least one changed entity
- Fail
- Partially Success
- Bulk Synchronization: Display only sync runs initiated by Bulk Sync From Date or Bulk Sync From CSV.
- Process Name: Filter by text contained in the process name.
- Synced Entity: Filter by the source or target entity ID or name.
- Changed Entities: Filter by the number of entities changed after the sync run.
- Deleted Entities: Show sync runs during which a target entity was deleted.
- Added Entities: Show sync runs during which a new entity was created in the target system and a new entity pair was created in the SyncNow DB.
- Sync Errors: Display sync runs where errors occurred.
🔎 Example Filters
- Example 1: Filter by a specific process to see all its sync runs.
- Example 2: Filter by date-time period to view sync runs within a specific timeframe.
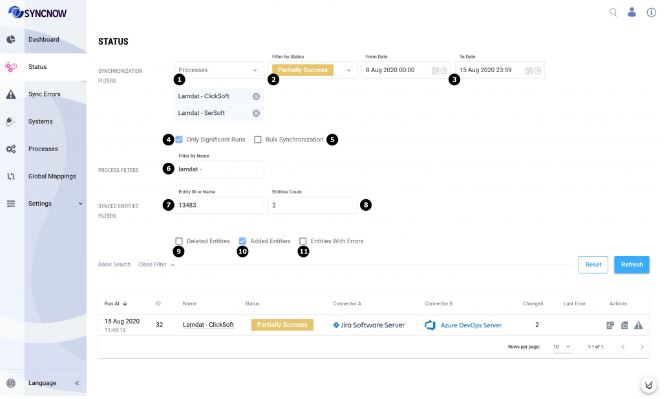 Figure 5: Filtered Sync Status
By using these filters, SyncNow operators can effectively monitor and manage synchronization processes, ensuring smooth and accurate data synchronization between work systems.